T Table Step by Step Guide for Accurate & Easy Understanding
Learn how to use the T Table easily. Explore its importance, step-by-step applications, and tips for accurate statistical analysis to boost your knowledge.
Did you know that over 70% of statistical decisions rely on the t-table for accuracy? This seemingly simple table ( also famous as T-distribution Table or Student’s T-Table) is the backbone of hypothesis testing, guiding researchers and data analysts to draw conclusions with confidence across countless fields.
Microsoft Excel, the computer software can somehow help in t-table processing, where Users can manually input data and use formulas to generate critical values from the T-Table.

How to Use the T-Table of T-Statistic
Understanding how to read and interpret the T Table is crucial for statistical analysis. Before diving into examples, let’s cover the key components you’ll need to navigate this essential tool effectively:
Pre-requisites for Using the T Table
Type of Test (One-Tailed or Two-Tailed):
Identify whether your test is one-tailed or two-tailed. This determines which row (one-tail or two-tail) you’ll use for mapping the alpha level. you can see at the top of the table the levels (0.50, 0.25, 0.20, 0.15…for the one-tail and 1.00, 0.50, 0.40, 0.30…for the two-tails) and you’ll see they vary based on whether the t-test is one-tail or two-tails
Degrees of Freedom (df):
Degrees of freedom are calculated as the sample size (n-1). Here the number of independent values are indicated by df that can vary in an analysis without breaking any constraints.
df=n−1
The degrees of freedom are either directly provided in the problem statement or, if not mentioned, can be calculated by subtracting one from the sample size (n−1n – 1n−1). The result gives you the value of degrees of freedom (df).
Alpha Level (Significance Level):
The alpha level (α) represents the threshold for rejecting the null hypothesis. Popular choices are 0.05, 0.01, or 0.10, and it reflects the probability of a Type I error.
Once you have these three elements, test type, degrees of freedom, and alpha level, you’re ready to read the T Table. Let’s understand this process with an example:
How to Read the T Table for a One-Tailed Test
Problem: Suppose we are conducting a one-tailed t-test with an alpha level of 0.05 and a total sample size of 20 participants. What is the critical value?
Solution:
First, we note that if the study involves 25 students. To calculate the degrees of freedom (df), we’ll have to subtract 1 from the total sample size:
Therefore, df = n – 1 = 25 – 1 = 24.
2. we see that our t-test is one-tailed. So we will choose the one-tail row to map our alpha level.

3. in the above highlighted row we can see the alpha value. Our alpha level for this example is 0.05. Let us map the same on the table.

4. When it is done, let us map the degrees of freedom under the leftmost column of the table under (df).

5. The critical which we’re searching, will presented by these two intersection.

Now as a resultant the critical value is the number at this intersection, which will guide you in comparing your calculated t-value to determine statistical significance.
By following this straightforward approach, you can easily navigate the T Table for any hypothesis testing scenario!
Sample Questions for Better Understanding
Question 1: For a two-tailed test with an alpha level of 0.30 and 18 as the sample size, what is the critical value we should compare t to?
Solution: As we can assume it from our problem statement. The sample size is 18. That’s why the degree of freedom (df) = 18 – 1 = 17. Also, we can see the test is two-tailed and has an alpha level of 0.30. The column as we can map on the T-Table, for two-tailed alpha values first and then map the value 0.30 across it. After that the value 17, we can map under the left-most column ‘ df ‘ and the answer is the intersection of the both, which is 1.069.
Question 2: For an one-tailed test, the sample size if 23. What is the degrees of freedom?
Solution: Degrees of freedom ( df ) = n – 1 = 23 – 1 = 22
Question 3: A research study conducts a one-tailed test with an alpha level of 0.10 and a sample size of 12. What critical value should be compared to the t value obtained as the test statistic?
Solution: The sample size is 12. Hence the degrees of freedom ( df ) = 12 – 1 = 11. Mapping the alpha level across the row for one-tailed alpha values and the df of 17 on the left-side of the table, we get our critical value as 1.363
The degree of freedom (df) = 12 – 1 = 11, therefore the sample is 12. Now for one-tailed alpha values the mapping the level of Alpha across the row and the ‘df’ of 17 on the left-side of the table, the critical value as 1.363 as we can get now.
When is T Distribution used?
T-distribution is used when you have a sample size because it is very similar to the normal distribution. Both of them have a little bit of difference in that the T-distribution curve is shorter and fatter than the normal distribution curve.
The most commonly used probability distribution patterns like T distribution, Z distribution, and Chi-Squared distribution, and this is very crucial to know the difference between them and also when to which distribution pattern.
T Table vs Z Table vs Chi Square Table
Chi-Square Table
Add context to your column. Help visitors understand the value they can get from your products and services.
T Table
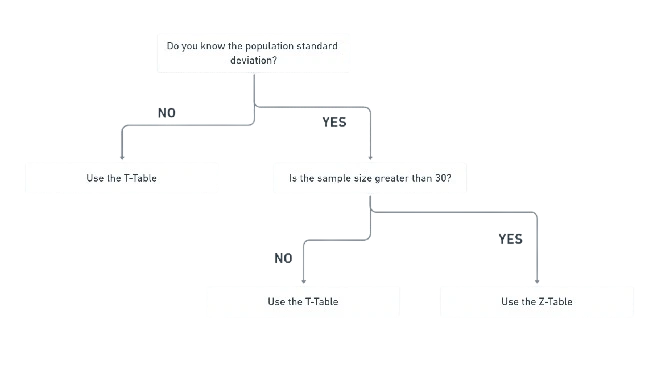
If the T-Score calculation process is done without the knowledge of the mean and the population standard deviation, then we can use T Table. Generally T Table has preference over Z Table to be used when the sample size is small (N<30)
Z Table
Z Table can be used when the population standard deviation and mean are known.

We can also assume, that Chi-Square with k degrees of freedom is the distribution of a sum of squares of k independent standard normal variables. And for the independence of two variables in a contingency table it can be used in test. And for to test the goodness of fit and observed data to if it matches to a theoretical one.
What is one tail vs two tail?
Let us get it known first that what is actually a ‘tail’, when comes to t distribution and also find out when should use one-tailed t test vs two-tailed t test.
As in the hypothesis test, both ( one-tailed and two-tailed) are used to determine the direction of effects or differences based on data. They differ based on the directionality of the test and the hypothesis being evaluated.


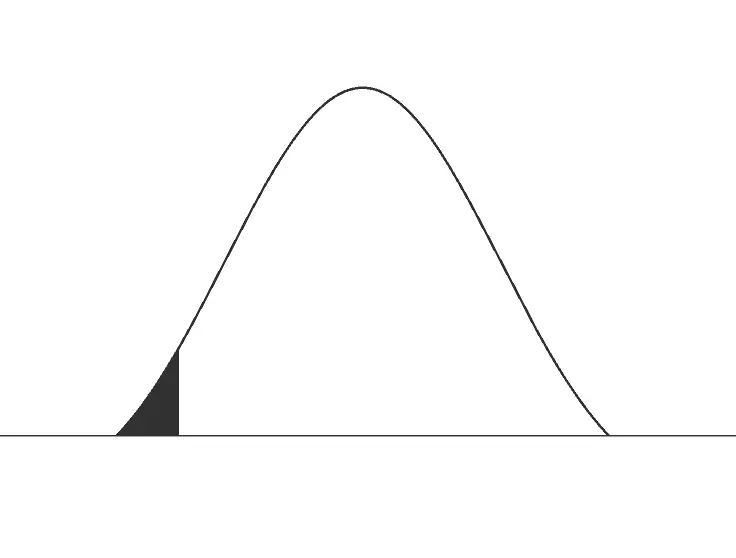
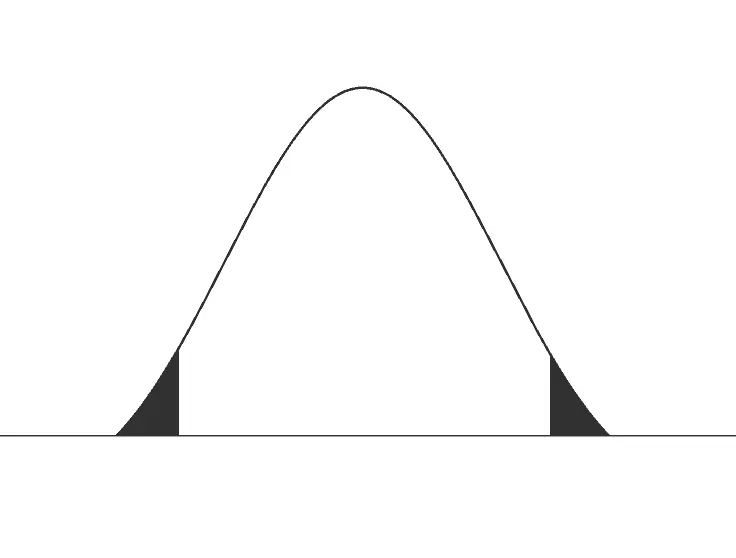
As we know, the end of any distribution is called a tail, including the distribution of test statistics. We can definitely see it in both of the upper images; the black shaded side is referred to as a tail.
Now it is so simple for us. We easily find that the image shaded black on one side is called one-tailed, and the image shaded black on both sides is called two-tailed. Chi-square distributions and F distribution ( the asymmetrical distributions) will have only one-tailed.
Distribution patterns like T-distribution and F-distribution, generally they’re two-tailed. The one-tailed test is also famous as the directional test whereas is two-tailed test is known as the non-directional test.
Now what are the criteria or we can say how anyone can find it well that whether I have to use a one-tailed t-test or a tow-tailed t-test?
The easiest way to determine is to decide first, use a two-tailed test if you want to use both the negative and the positive end of the distribution otherwise the one-tailed t-test will be used if your comparison is one-directional.
For example; If you want to check whether Group A height differs in both directions (either taller or shorter) compared to Group B, you should use a two-tailed test. On the other hand, if your goal is only to determine whether Group A is taller than Group B, and you have no interest in whether it is shorter, a one-tailed test is the right choice.
When in doubt, it’s generally safer to use a two-tailed test, as it evaluates differences in both directions.
T statistic formula or T Score formula
The value of the T-statistic depends on the distance between the sample mean and the hypothesized mean:
- Close to Zero: When the sample mean is near the hypothesized mean.
- Larger Value: When the sample mean is far from the hypothesized mean.
So it is clear that how large or how small the T statistic is depends on how close or far away the sample mean is from the hypothesized mean. we would get a T statistic close to zero if the sample mean is close to the hypothesized mean or the larger T-Static will be achieved if the sample mean is far away from the hypothesized mean.
Why is T Table called as Student’s T Table or Student’s T Distribution?
The student’s table or the Student’s t-distribution is used to check the response of two groups and whether the difference between them is statistically significant or not? Understanding its history can help you appreciate this foundational statistical concept better and apply it with confidence.
History of T Table
The t-statistic and t-distribution date back to the 19th century, T-distribution is the early foundation led by Friedrich Helmert and Jacob Luroth in 1876. Helmert and Lüroth introduced concepts that later influenced the t-distribution. Understanding such historical developments can enrich your general knowledge with more interesting facts and trivia quizzes.
Friedrich Helmert (31 July 1843 – 15 June 1917): Born in the Kingdom of Saxony, Helmert worked hard and was very ethusiastic in Geodesy, in 1872 he became professor at new technical university RWTH Aachen.
There in RWTH ( Rheinisch-Westfälische Technische Hochschule Aachen)he wrote “Die mathematischen und physikalischen Theorieen der höheren Geodäsie (translation; The Mathematical and Physical Theories of Higher Geodesy)” provided the basis for modern Geodesy.


Jacob Luroth (1844–1910): was a German mathematician, he was renowned for Luroth’s theorem, Lüroth quartics, and his research on Pascal’s theorem.
While the t-distribution is often attributed to William Sealy Gosset, Helmert and Lüroth are believed to have first derived it. Additionally, Karl Pearson’s 1895 paper referenced the t-distribution in its early form, known as Pearson Type IV.
The t-statistic, however, is credited to William Sealy Gosset (1876–1937), who worked as the Head Brewer at Guinness Brewery and is regarded as the father of modern British statistics. In 1908, Gosset introduced the t-statistic in a paper published in Biometrika under the pseudonym ‘Student.’
The name ‘Student’s t-distribution’ comes from his pen name and has no connection to the literal term “student” in English. Initially, it was referred to as ‘Student’s Z’ or ‘Student’s test of statistical significance’ before being widely known as Student’s t-distribution.
Key Contributions
- Helmert and Luroth: Early derivations of the t-distribution in 1876.
- Karl Pearson: Mentioned the t-distribution in 1895 as Pearson Type IV.
- William Gosset: Formally introduced the t-statistic in 1908

Conclusion
The T Table, or Student’s T Table, remains an indispensable tool in statistical analysis, bridging the gap between raw data and meaningful insights. Whether you’re conducting hypothesis tests, calculating critical values, or analyzing small sample sizes, the T Table ensures accuracy and reliability in decision-making. Its flexibility in one-tailed and two-tailed tests, alongside its adaptability for varying degrees of freedom and significance levels, makes it a cornerstone of statistical methods across fields like research, education, and business analytics.
FAQs
Approximately 45% of people used the FAQs area for T-table to gain precise, actual, and technical answers


